Chapter 6. Radiation Properties of Pulsars
Move from single pulses and subpulses to mean profiles, polarization, and multiwavelength pulse shapes to understand what a pulsar actually looks like in observations.
This chapter reads most like an atlas of observational phenomena. It does not rush to present a unified theory. Instead, it unfolds what pulsars actually look like in radio observations, layer by layer.
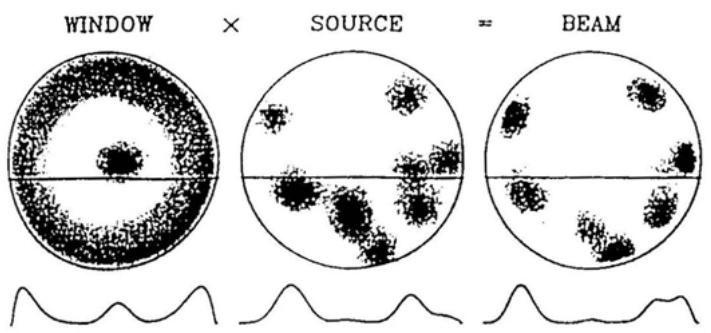
The book uses the idea of a "radiation window" to organise the many features of average profiles. What you observe is not the whole star glowing uniformly, but the trace left when your line of sight cuts across a finite emitting region.
Why single pulses and average profiles are not the same object
One of the most helpful parts of this chapter is that it separates what is emitted in an individual rotation from what appears only after many rotations are stacked together:
- single pulses highlight instantaneous structure
- subpulses highlight drifting components and emission units
- mean profiles highlight stable geometry and long-term statistical shape
That distinction matters a great deal. In PSRUI and in many archive viewers, what you usually inspect is the averaged result. The book reminds us that a large amount of pulse-to-pulse variability is hidden beneath that stable profile.
Why profile shapes are so diverse
The book walks through:
- broad pulses
- main pulses and interpulses
- mode changing
- profile reshaping across observing frequency
Taken together, these phenomena point to one conclusion: the average pulse is not simply the projection of a single fixed bright spot. It is better understood as the outcome of radiation geometry, line-of-sight cuts, and emission heights that change with frequency.
Why polarization is a key window into field geometry
Another major focus of the chapter is polarization. Strong linear polarization, position-angle swings, and circular components carry much more information than total intensity alone. The polar-cap geometry model introduced later can be tested precisely because these polarization facts are available.
Why multiwavelength profiles deserve separate attention
The chapter ends by comparing pulse profiles in radio, optical, X-ray, and -ray bands, stressing that pulses at different energies do not necessarily come from the same height, the same mechanism, or the same geometric slice.
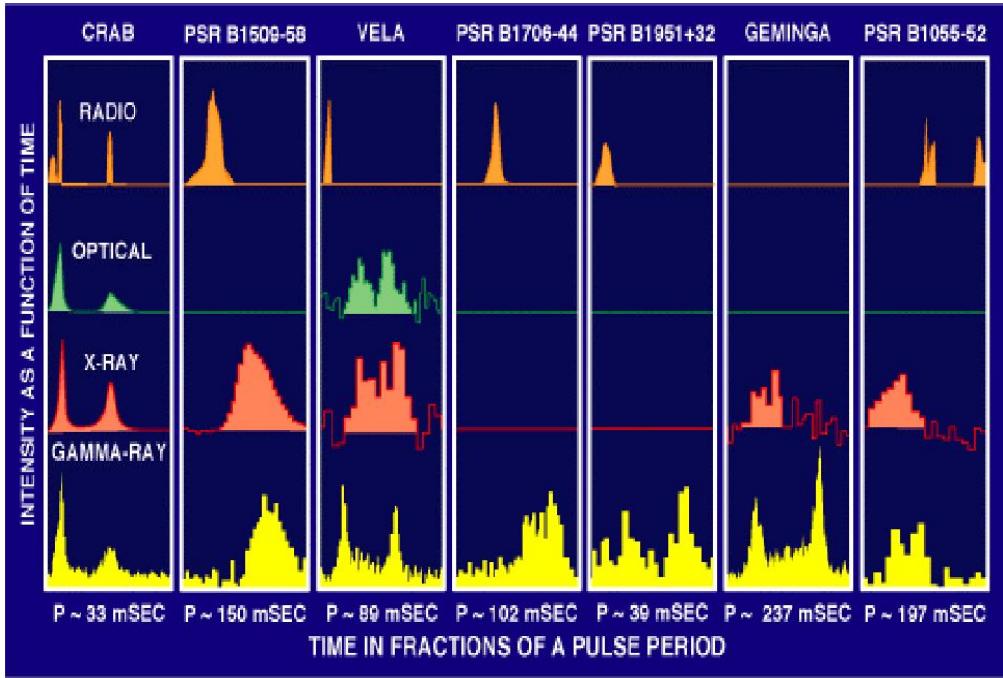
The point of the figure is that pulsars are not just replaying one signal in different colours. The whole magnetosphere is active at once through multiple radiation mechanisms.
How this relates to data viewers
This chapter is especially helpful when compared directly with the quantities you actually inspect in archive data:
- total-intensity profiles correspond to mean pulse morphology
- Stokes parameters and position angle correspond to polarization structure
- changes in profile width across frequency connect to empirical pictures such as frequency-dependent emission height
Continue with:
Chapter 5. Spin-down Power and the Magnetic Dipole Model
Connect period and period derivative to rotational energy loss, magnetic field strength, braking index, and characteristic age in the classic pulsar parameter framework.
Chapter 7. Radiation Mechanisms of Pulsars
Follow the chain from the magnetosphere and charge separation to particle acceleration, curvature radiation, and inverse Compton scattering to understand the engine behind the mean pulse.